Most regional CRE brokerage leaders have a general sense of how their pipeline is performing. They know which deals are hot, which agents are active, and which transactions have been quiet for longer than they should be. That intuitive awareness is valuable and it's built from years of working the market. But it has a structural limitation: it doesn't scale beyond what a Managing Broker can personally hold in memory, and it doesn't surface the patterns that only become visible when deal data is aggregated across the team.
Three specific pipeline velocity metrics — time in stage, stalled deal age, and tour-to-LOI conversion rate — tell a Managing Broker more about brokerage performance than any monthly transaction count. And most regional firms are not tracking them systematically.
Time in stage: The most useful diagnostic metric
Time in stage measures how long a deal has been in its current pipeline stage — prospect, active requirement, touring, LOI, lease negotiation, executed. The metric is simple to define and surprisingly difficult to track without a structured pipeline system, because capturing it requires recording when a deal entered each stage, not just what stage it's currently in.
The analytical value of time in stage comes from comparison to baseline expectations. A deal in the LOI negotiation stage for 30 days is not automatically a concern. A deal in the same stage for 90 days, in a market where similar deals typically complete the LOI-to-lease process in 45–60 days, is flagging something: a counterparty who has gone quiet, a redline process that has stalled, or an underlying deal dynamic that isn't tracking toward execution.
Without time-in-stage data, a Managing Broker reviewing the pipeline sees a snapshot — this deal is in LOI, that deal is in negotiation — without the duration context that tells them whether each deal is tracking normally or showing warning signs. The snapshot is informative. The snapshot with timestamps is a management tool.
Setting time-in-stage benchmarks requires knowing your own history. What does your deal flow look like? For a Dallas office leasing specialist working 5,000–20,000 SF requirements, typical LOI-to-executed-lease cycles might run 30–60 days for straightforward deals, 60–90 days for deals with more complex tenant improvement negotiations, and 90+ days as an outlier flag. Those benchmarks are specific to deal type, market, and brokerage. There's no single industry standard to import — you build yours from your own transaction history.
Stalled deal age: The early warning system
Stalled deal age is closely related to time in stage but focuses specifically on deals that have gone quiet — no recorded activity, no contact log entry, no stage movement — for a defined period. The threshold for "stalled" depends on deal type: a requirement that was toured three weeks ago with no follow-up is probably fine; a deal in LOI negotiation with no contact log activity for three weeks is a warning sign.
The failure mode that stalled deal age catches is a deal that dies gradually rather than by explicit withdrawal. In regional brokerage pipeline management, the most common quiet failure scenario looks like this: an LOI is submitted, the landlord's counsel begins a slow-walk on redlines, the tenant's internal team gets distracted by other priorities, the broker checks in once or twice and gets non-committal responses, and over the course of six to eight weeks, the deal just stops moving. By the time it's officially dead, the opportunity to intervene — to reset the timeline, to escalate to the principal, to bring in additional decision-maker contacts — has passed.
Stalled deal age monitoring makes that gradual failure visible before the window for intervention closes. A Managing Broker who sees that a deal in LOI has had no logged activity for 18 days can ask the question directly: is this still a live deal? That question, asked at the right time, sometimes saves deals that would have otherwise died by neglect.
Tour-to-LOI conversion rate: The quality metric
Tour-to-LOI conversion rate measures what percentage of property tours in your pipeline advance to a signed LOI within a defined timeframe — typically 60 or 90 days post-tour. This metric looks at volume efficiency: how many tours does your brokerage conduct per LOI generated?
The metric is interesting because it surfaces two different kinds of problems. A very low tour-to-LOI conversion rate could mean your team is showing too many spaces that aren't well-matched to requirements — chasing activity rather than generating qualified tours. A very high rate could mean your team is being too selective about what they tour, potentially leaving deals on the table by not exploring enough options. The right benchmark is somewhere in the middle and is market-specific and deal-type-specific.
Tour-to-LOI conversion also varies by agent. Within the same brokerage working the same submarkets, an agent with a strong pre-tour qualification process — who has done the comp analysis before the tour, who has had the substantive conversation about budget, timeline, and space requirements — will typically convert at a higher rate than an agent who tours first and qualifies later. This is useful management information. Not as a punitive metric but as a signal about where coaching and process support can produce the most improvement.
What these three metrics don't tell you
Pipeline velocity metrics are diagnostic tools. They tell you that something is happening or not happening in your deal flow; they don't tell you why. A tour-to-LOI conversion rate that drops in a specific submarket over a quarter could reflect market softening, a specific competing listing that's absorbing tenant interest, a pricing problem on your listings, or just statistical variance in a small sample. Velocity metrics point you to questions worth investigating — they don't answer those questions by themselves.
We're not saying that pipeline velocity dashboards replace broker judgment or Managing Broker relationships. They don't. What they do is surface the specific deals and patterns that deserve closer attention — so that experienced judgment can be applied at the right moments rather than spread evenly across a 30-deal pipeline where some deals need attention urgently and others don't need attention at all.
Getting started: Building the pipeline data foundation
None of these metrics are computable without consistent deal stage logging. That's the foundational requirement and the reason most regional brokerages don't have these metrics today: deal stage data is inconsistently entered into CRM systems, logged with different stage labels by different agents, and often updated only when a deal reaches a major milestone rather than when incremental events (tours, calls, document exchanges) occur.
The path to pipeline velocity tracking runs through consistent data discipline — defining clear stage definitions that everyone on the team uses the same way, creating lightweight logging habits for contact and activity events, and reviewing pipeline data regularly enough that the discipline is maintained. This is organizational change work, not just technology work. The technology makes the metrics visible; the team discipline generates the data that makes the metrics accurate.
For a brokerage considering building out pipeline velocity tracking, start with the simplest version: define five deal stages (prospect, active requirement, touring, LOI, executed), record entry date for each stage, and review time-in-stage for every active deal in your weekly pipeline meeting. That baseline practice, done consistently, gives you the data foundation the more sophisticated metrics build on.
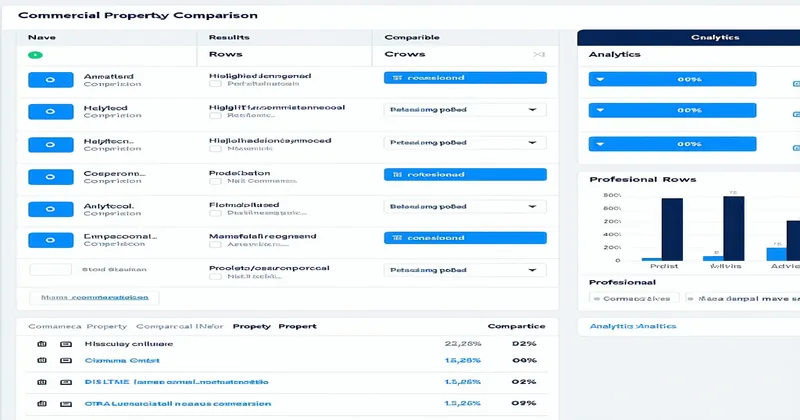
If you'd like to see how Cremdeal's pipeline dashboard surfaces time-in-stage and stalled deal tracking for a brokerage your size, request a demo and we'll walk through it against a representative pipeline view.